
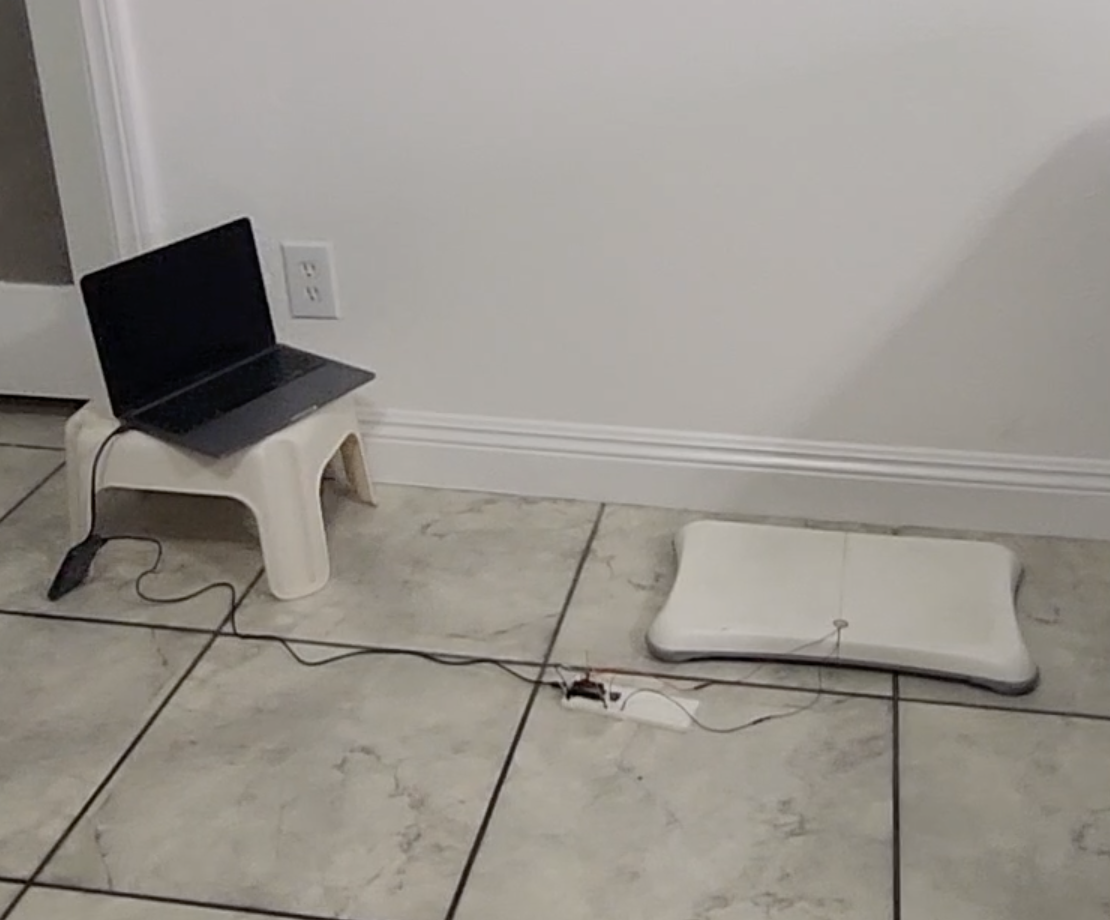
I built a simple balance board tracker using a Feather HUZZAH32, a vibration sensor, and a button. Hit the button to start a session, wobble away, and it logs how shaky or steady things are so I can look back over a week and spot patterns (and hopefully progress).

Dec 27, 2025
This project turns a balance board into a week-long “stability diary.” Using a vibration sensor and a single button, an ESP32 Feather HUZZAH32 measures how shaky (or smooth) my balance sessions are and uploads that data to Adafruit IO.
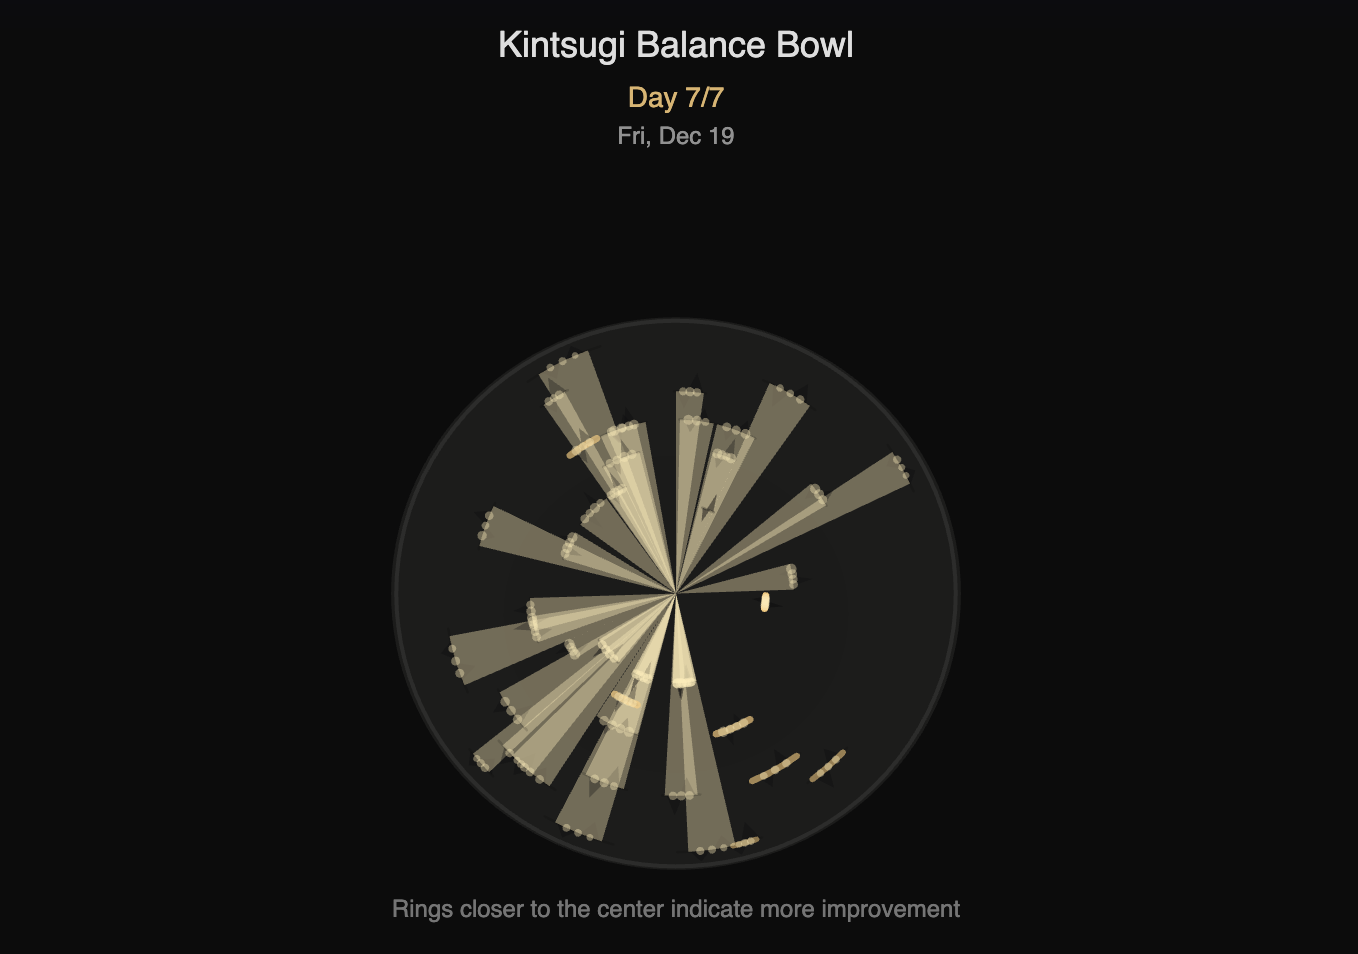
To visualize the week, I created a p5.js artwork called Kintsugi Balance Bowl: the “worst” wobble spikes become cracks in a ceramic bowl, and heal with signs of improvement.
I wanted something that felt like fitness feedback without being overly complicated. To kickstart the my return to getting back in shape, I wanted to look at how my sense of balance was developing. Using my trusty old Wii Balance Board, and a vibration sensor wired to that plus my Arduino, I was able to log my progress in a way that looked like a seismograph for my stance.
Inputs
Output
vibeAvg = average vibration intensity over the upload window (great for weekly graphing)

Instead of spamming raw sensor values, the sketch logs a summary every few seconds:
vibeAvg = the average “envelope” vibration value across the windowThat means you get clean data on Adafruit IO with a manageable upload rate.
Why this works:
Raw piezo readings are spiky and chaotic. By smoothing into a windowed “intensity,” my week-long graphs became readable and comparable.
config.hI learned about making this header file in class, and the important part is that it contains my Wi-Fi network + Adafruit IO credentials, which initializes io.
This is the full working version: one button action, one Adafruit feed, logs vibration intensity.
#include "config.h"

// HUZZAH32: A2 is GPIO34 (ADC1) -> safe with Wi-Fi
#define VIBE_PIN   A2
#define BUTTON_PIN 13   // button -> GND, using INPUT_PULLUP

AdafruitIO_Feed *myfeed = io.feed("balance_feed");

// Timing
const uint32_t SAMPLE_PERIOD_US = 2000; // 500 Hz sampling
const uint32_t UPLOAD_PERIOD_MS = 3000; // send every 3 seconds while logging

// Envelope / baseline
float baseline = 0;
const float BASELINE_ALPHA = 0.01f;

// Window stats (per upload window)
uint32_t winEnergy = 0;
uint32_t winSamples = 0;
uint16_t winPeak = 0;

// Button debounce
const uint32_t DEBOUNCE_MS = 30;
bool loggingOn = false;
bool lastBtnRead = HIGH;
bool btnStable = HIGH;
uint32_t lastDebounceMs = 0;

// Timers
uint32_t lastSampleUs = 0;
uint32_t lastUploadMs = 0;

void resetWindow() {
  winEnergy = 0;
  winSamples = 0;
  winPeak = 0;
}

void handleButtonToggle() {
  bool reading = digitalRead(BUTTON_PIN);

  if (reading != lastBtnRead) {
    lastDebounceMs = millis();
    lastBtnRead = reading;
  }

  if (millis() - lastDebounceMs > DEBOUNCE_MS) {
    if (reading != btnStable) {
      btnStable = reading;

      // Toggle only on press-down
      if (btnStable == LOW) {
        loggingOn = !loggingOn;

        if (loggingOn) {
          Serial.println("LOGGING START");
          resetWindow();
          lastUploadMs = millis();
        } else {
          Serial.println("LOGGING STOP");
          resetWindow();
        }
      }
    }
  }
}

void setup() {
  Serial.begin(115200);
  while (!Serial) delay(10);

  pinMode(BUTTON_PIN, INPUT_PULLUP);

  Serial.print("Connecting to Adafruit IO");
  io.connect();

  uint32_t t0 = millis();
  while (io.status() < AIO_CONNECTED) {
    io.run();
    Serial.print(".");
    delay(500);

    // Helpful status message if stuck connecting
    if (millis() - t0 > 6000) {
      Serial.println();
      Serial.print("AIO status: ");
      Serial.println(io.statusText());
      t0 = millis();
    }
  }

  Serial.println();
  Serial.println(io.statusText());

  // Seed baseline (quiet board at boot helps)
  baseline = analogRead(VIBE_PIN);

  lastSampleUs = micros();
  lastUploadMs = millis();

  Serial.println("Ready. Press button to start/stop logging.");
}

void loop() {
  io.run();
  handleButtonToggle();

  // Let Wi-Fi breathe
  delay(1);

  // Fixed-rate sampling
  uint32_t nowUs = micros();
  if (nowUs - lastSampleUs >= SAMPLE_PERIOD_US) {
    lastSampleUs += SAMPLE_PERIOD_US;

    int raw = analogRead(VIBE_PIN);

    // Slow baseline adaptation
    baseline = baseline * (1.0f - BASELINE_ALPHA) + raw * BASELINE_ALPHA;

    // Envelope value (vibration intensity)
    uint16_t env = (uint16_t)abs(raw - (int)baseline);

    if (loggingOn) {
      winEnergy += env;
      winSamples++;
      if (env > winPeak) winPeak = env;
    }
  }

  // Upload summary periodically while logging
  uint32_t nowMs = millis();
  if (loggingOn && (nowMs - lastUploadMs >= UPLOAD_PERIOD_MS)) {
    lastUploadMs += UPLOAD_PERIOD_MS;

    // Average envelope intensity
    uint16_t vibeAvg = (winSamples > 0) ? (uint16_t)(winEnergy / winSamples) : 0;

    Serial.print("Sending -> vibeAvg=");
    Serial.print(vibeAvg);
    Serial.print(" peak=");
    Serial.println(winPeak);

    // Upload ONE value to feed
    myfeed->save(vibeAvg);

    resetWindow();
  }
}
LOGGING START.vibeAvg rise and fall.
For the second half of this project, I used the idea of kintsugi—repairing broken pottery with gold—to represent how balance improves through repetition. Each day of practice becomes a “ring” on the bowl. The rings start near the outside and move inward over time, so the closer a ring is to the center, the more improvement it represents.
To make the difference between “damage” and “repair” easy to read, I use two different visual languages. Damage is drawn as jagged triangular chips that bite into the ring, like ceramic that’s been fractured. Repair is drawn as smooth gold arc stitches, sometimes with small beads, to simulate the gold filler used in kintsugi. As the days progress, the visualization intentionally shifts toward more gold: some of that comes from lower wobble (better stability), and some is a deliberate day-by-day increase so the week reads as a clear progression rather than a subtle statistical change.
Check out the full P5JS code HERE
function preload() {
  let url =
    "https://io.adafruit.com/api/v2/MarcusT_/feeds/balance-feed/data?limit=" +
    limit +
    "&include=value";
  data = loadJSON(url);
}
This project reminded me that a simple system can still feel meaningful if the idea is strong. I kept the hardware interaction super minimal (one button to start and stop logging) because I missed the day for sensor distribution and had to get creative with my limited option. The sensor ended up being a great “wobble detector”: it’s not pretending to measure perfect balance, but it captures the real moments. From tiny corrections, edge taps, and those sudden shakes when you lose stability and recover.
The biggest lesson for me was that the data pipeline is part of the design. Getting the ESP32 to behave while connected to Wi-Fi, deciding what to log (and how often), and keeping the feed clean enough to visualize made me think beyond just “does it work?” The Kintsugi bowl visualization brought everything together: vibration spikes become cracks, and the gold repair reframes those rough moments as progress instead of failure. Scrubbing through the timeline made the week feel like a story, which is exactly what I wanted... Data that’s not just numbers, but something I could actually reflect on.
We draw the track as a polyline (sampled points) and orient all glyphs by rotating to the tangent (rotate(p.ang)).
// Parametric curve + tangent
x = a * sin(t),  y = (b/2) * sin(2t)

function infinityPoint(tau, a, b) {
  const x = a * sin(tau);
  const y = (b * 0.5) * sin(2 * tau);
  const dx = a * cos(tau);
  const dy = b * cos(2 * tau);
  const ang = atan2(dy, dx); // tangent angle
  return { x, y, ang };
}
Seasons = Turtle feeding cycles
Fin Strokes = Distance Measuring
Breath = Religious Timing/Calendar
Blink = Day/Night Cycle
// Parametric curve + tangent
x = a * sin(t),  y = (b/2) * sin(2t)

function infinityPoint(tau, a, b) {
  const x = a * sin(tau);
  const y = (b * 0.5) * sin(2 * tau);
  const dx = a * cos(tau);
  const dy = b * cos(2 * tau);
  const ang = atan2(dy, dx); // tangent angle
  return { x, y, ang };
}
Track Color Season color slowly shifts via four stops using seasonalHue() and wrap-aware lerpHue()
const seasonHue = seasonalHue(seasonCyc); // amber → green → violet → cyan
stroke(seasonHue, …); drawInfinityPolyline(...);
Track Color: Season color slowly shifts via four stops using seasonalHue() and wrap-aware lerpHue()
const seasonHue = seasonalHue(seasonCyc); // amber → green → violet → cyan
stroke(seasonHue, …); drawInfinityPolyline(...);
An image of MF DOOM's iconic mask is divided into a grid of tiles. When a button is pressed, random hidden tiles are revealed, and newly revealed tiles briefly glow in response to the sound.
revealed[r][c] = true;This project sits somewhere between an instrument, a game, and a piece of interactive visual art.
It asks a simple question:
What if making music wasn’t about building something new — but revealing something that already exists?
By tying sound, touch, and imagery together, the machine transforms rhythm into progress.
Sometimes, the beat isn’t the point. Sometimes, the beat is the key.
I built a simple balance board tracker using a Feather HUZZAH32, a vibration sensor, and a button. Hit the button to start a session, wobble away, and it logs how shaky or steady things are so I can look back over a week and spot patterns (and hopefully progress).
Dec 27, 2025
This project turns a balance board into a week-long “stability diary.” Using a vibration sensor and a single button, an ESP32 Feather HUZZAH32 measures how shaky (or smooth) my balance sessions are and uploads that data to Adafruit IO.
To visualize the week, I created a p5.js artwork called Kintsugi Balance Bowl: the “worst” wobble spikes become cracks in a ceramic bowl, and heal with signs of improvement.
I wanted something that felt like fitness feedback without being overly complicated. To kickstart the my return to getting back in shape, I wanted to look at how my sense of balance was developing. Using my trusty old Wii Balance Board, and a vibration sensor wired to that plus my Arduino, I was able to log my progress in a way that looked like a seismograph for my stance.
Inputs
Output
vibeAvg = average vibration intensity over the upload window (great for weekly graphing)
Instead of spamming raw sensor values, the sketch logs a summary every few seconds:
vibeAvg = the average “envelope” vibration value across the windowThat means you get clean data on Adafruit IO with a manageable upload rate.
Why this works:
Raw piezo readings are spiky and chaotic. By smoothing into a windowed “intensity,” my week-long graphs became readable and comparable.
config.hI learned about making this header file in class, and the important part is that it contains my Wi-Fi network + Adafruit IO credentials, which initializes io.
This is the full working version: one button action, one Adafruit feed, logs vibration intensity.
#include "config.h"

// HUZZAH32: A2 is GPIO34 (ADC1) -> safe with Wi-Fi
#define VIBE_PIN   A2
#define BUTTON_PIN 13   // button -> GND, using INPUT_PULLUP

AdafruitIO_Feed *myfeed = io.feed("balance_feed");

// Timing
const uint32_t SAMPLE_PERIOD_US = 2000; // 500 Hz sampling
const uint32_t UPLOAD_PERIOD_MS = 3000; // send every 3 seconds while logging

// Envelope / baseline
float baseline = 0;
const float BASELINE_ALPHA = 0.01f;

// Window stats (per upload window)
uint32_t winEnergy = 0;
uint32_t winSamples = 0;
uint16_t winPeak = 0;

// Button debounce
const uint32_t DEBOUNCE_MS = 30;
bool loggingOn = false;
bool lastBtnRead = HIGH;
bool btnStable = HIGH;
uint32_t lastDebounceMs = 0;

// Timers
uint32_t lastSampleUs = 0;
uint32_t lastUploadMs = 0;

void resetWindow() {
  winEnergy = 0;
  winSamples = 0;
  winPeak = 0;
}

void handleButtonToggle() {
  bool reading = digitalRead(BUTTON_PIN);

  if (reading != lastBtnRead) {
    lastDebounceMs = millis();
    lastBtnRead = reading;
  }

  if (millis() - lastDebounceMs > DEBOUNCE_MS) {
    if (reading != btnStable) {
      btnStable = reading;

      // Toggle only on press-down
      if (btnStable == LOW) {
        loggingOn = !loggingOn;

        if (loggingOn) {
          Serial.println("LOGGING START");
          resetWindow();
          lastUploadMs = millis();
        } else {
          Serial.println("LOGGING STOP");
          resetWindow();
        }
      }
    }
  }
}

void setup() {
  Serial.begin(115200);
  while (!Serial) delay(10);

  pinMode(BUTTON_PIN, INPUT_PULLUP);

  Serial.print("Connecting to Adafruit IO");
  io.connect();

  uint32_t t0 = millis();
  while (io.status() < AIO_CONNECTED) {
    io.run();
    Serial.print(".");
    delay(500);

    // Helpful status message if stuck connecting
    if (millis() - t0 > 6000) {
      Serial.println();
      Serial.print("AIO status: ");
      Serial.println(io.statusText());
      t0 = millis();
    }
  }

  Serial.println();
  Serial.println(io.statusText());

  // Seed baseline (quiet board at boot helps)
  baseline = analogRead(VIBE_PIN);

  lastSampleUs = micros();
  lastUploadMs = millis();

  Serial.println("Ready. Press button to start/stop logging.");
}

void loop() {
  io.run();
  handleButtonToggle();

  // Let Wi-Fi breathe
  delay(1);

  // Fixed-rate sampling
  uint32_t nowUs = micros();
  if (nowUs - lastSampleUs >= SAMPLE_PERIOD_US) {
    lastSampleUs += SAMPLE_PERIOD_US;

    int raw = analogRead(VIBE_PIN);

    // Slow baseline adaptation
    baseline = baseline * (1.0f - BASELINE_ALPHA) + raw * BASELINE_ALPHA;

    // Envelope value (vibration intensity)
    uint16_t env = (uint16_t)abs(raw - (int)baseline);

    if (loggingOn) {
      winEnergy += env;
      winSamples++;
      if (env > winPeak) winPeak = env;
    }
  }

  // Upload summary periodically while logging
  uint32_t nowMs = millis();
  if (loggingOn && (nowMs - lastUploadMs >= UPLOAD_PERIOD_MS)) {
    lastUploadMs += UPLOAD_PERIOD_MS;

    // Average envelope intensity
    uint16_t vibeAvg = (winSamples > 0) ? (uint16_t)(winEnergy / winSamples) : 0;

    Serial.print("Sending -> vibeAvg=");
    Serial.print(vibeAvg);
    Serial.print(" peak=");
    Serial.println(winPeak);

    // Upload ONE value to feed
    myfeed->save(vibeAvg);

    resetWindow();
  }
}
LOGGING START.vibeAvg rise and fall.
For the second half of this project, I used the idea of kintsugi—repairing broken pottery with gold—to represent how balance improves through repetition. Each day of practice becomes a “ring” on the bowl. The rings start near the outside and move inward over time, so the closer a ring is to the center, the more improvement it represents.
To make the difference between “damage” and “repair” easy to read, I use two different visual languages. Damage is drawn as jagged triangular chips that bite into the ring, like ceramic that’s been fractured. Repair is drawn as smooth gold arc stitches, sometimes with small beads, to simulate the gold filler used in kintsugi. As the days progress, the visualization intentionally shifts toward more gold: some of that comes from lower wobble (better stability), and some is a deliberate day-by-day increase so the week reads as a clear progression rather than a subtle statistical change.
Check out the full P5JS code HERE
function preload() {
  let url =
    "https://io.adafruit.com/api/v2/MarcusT_/feeds/balance-feed/data?limit=" +
    limit +
    "&include=value";
  data = loadJSON(url);
}
This project reminded me that a simple system can still feel meaningful if the idea is strong. I kept the hardware interaction super minimal (one button to start and stop logging) because I missed the day for sensor distribution and had to get creative with my limited option. The sensor ended up being a great “wobble detector”: it’s not pretending to measure perfect balance, but it captures the real moments. From tiny corrections, edge taps, and those sudden shakes when you lose stability and recover.
The biggest lesson for me was that the data pipeline is part of the design. Getting the ESP32 to behave while connected to Wi-Fi, deciding what to log (and how often), and keeping the feed clean enough to visualize made me think beyond just “does it work?” The Kintsugi bowl visualization brought everything together: vibration spikes become cracks, and the gold repair reframes those rough moments as progress instead of failure. Scrubbing through the timeline made the week feel like a story, which is exactly what I wanted... Data that’s not just numbers, but something I could actually reflect on.
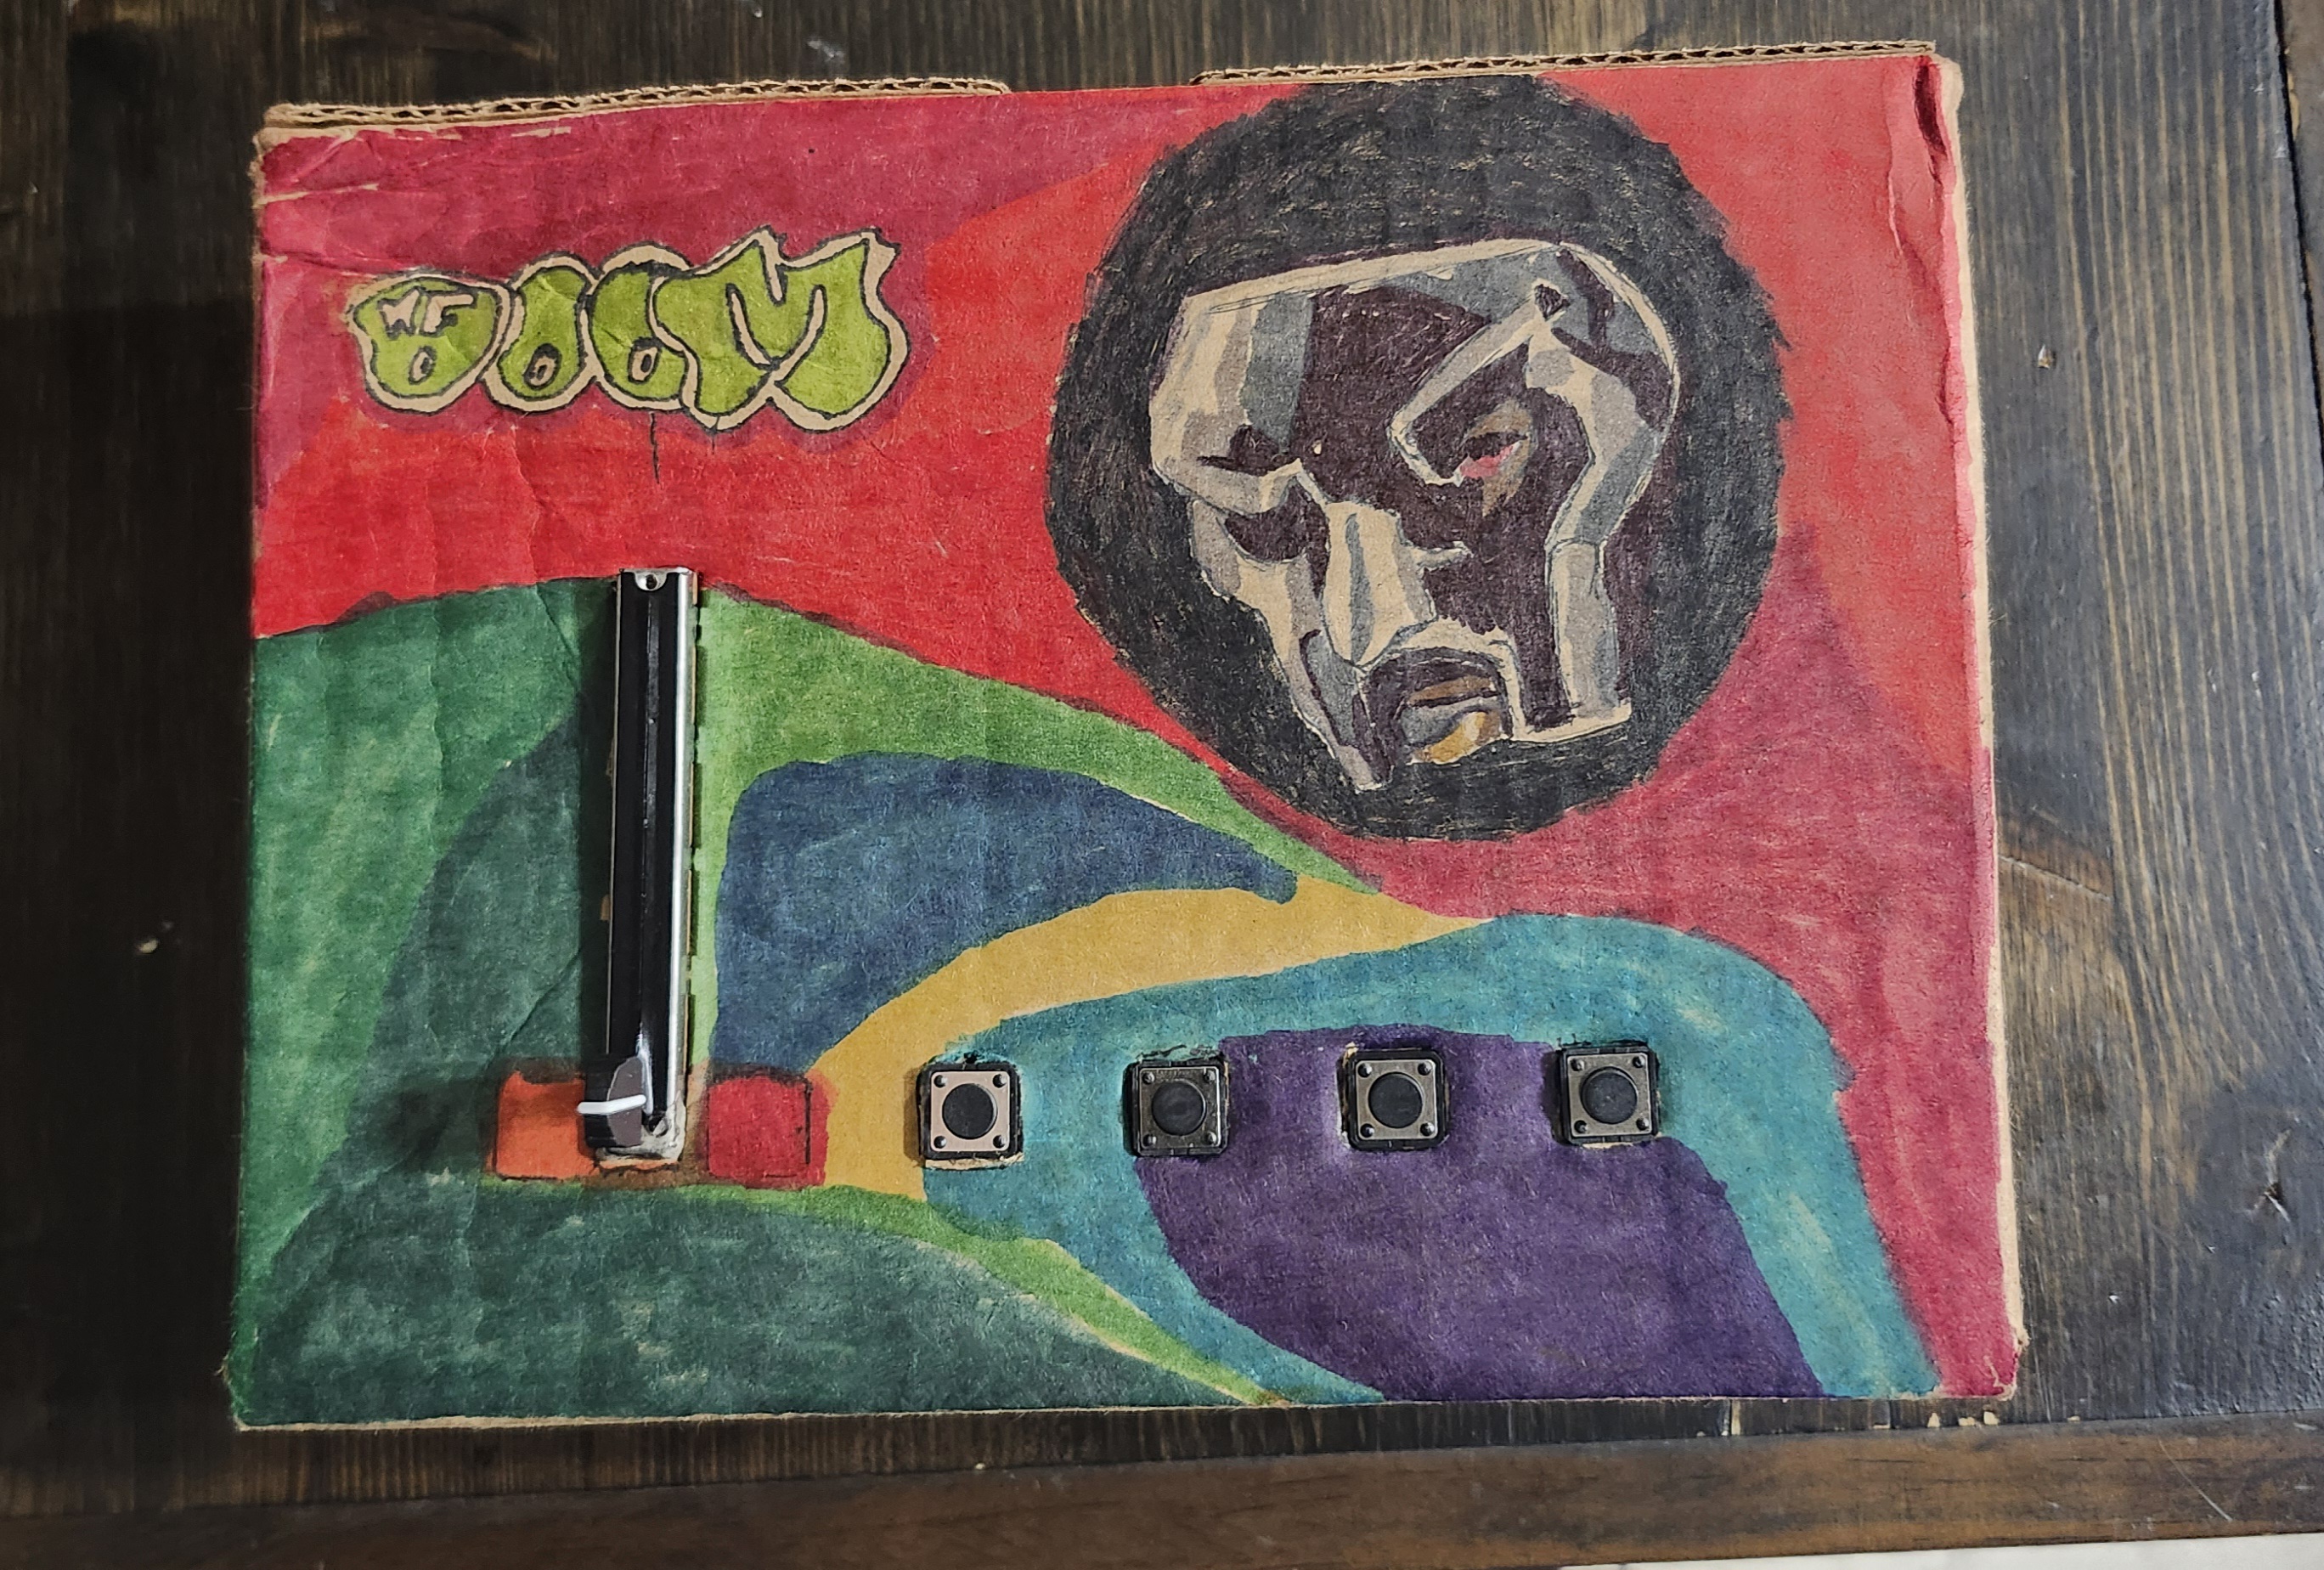
At the heart of the system is a custom-built controller powered by an Arduino ESP32 Feather housed in a cardboard enclosure.
The interface includes:
.jpg)
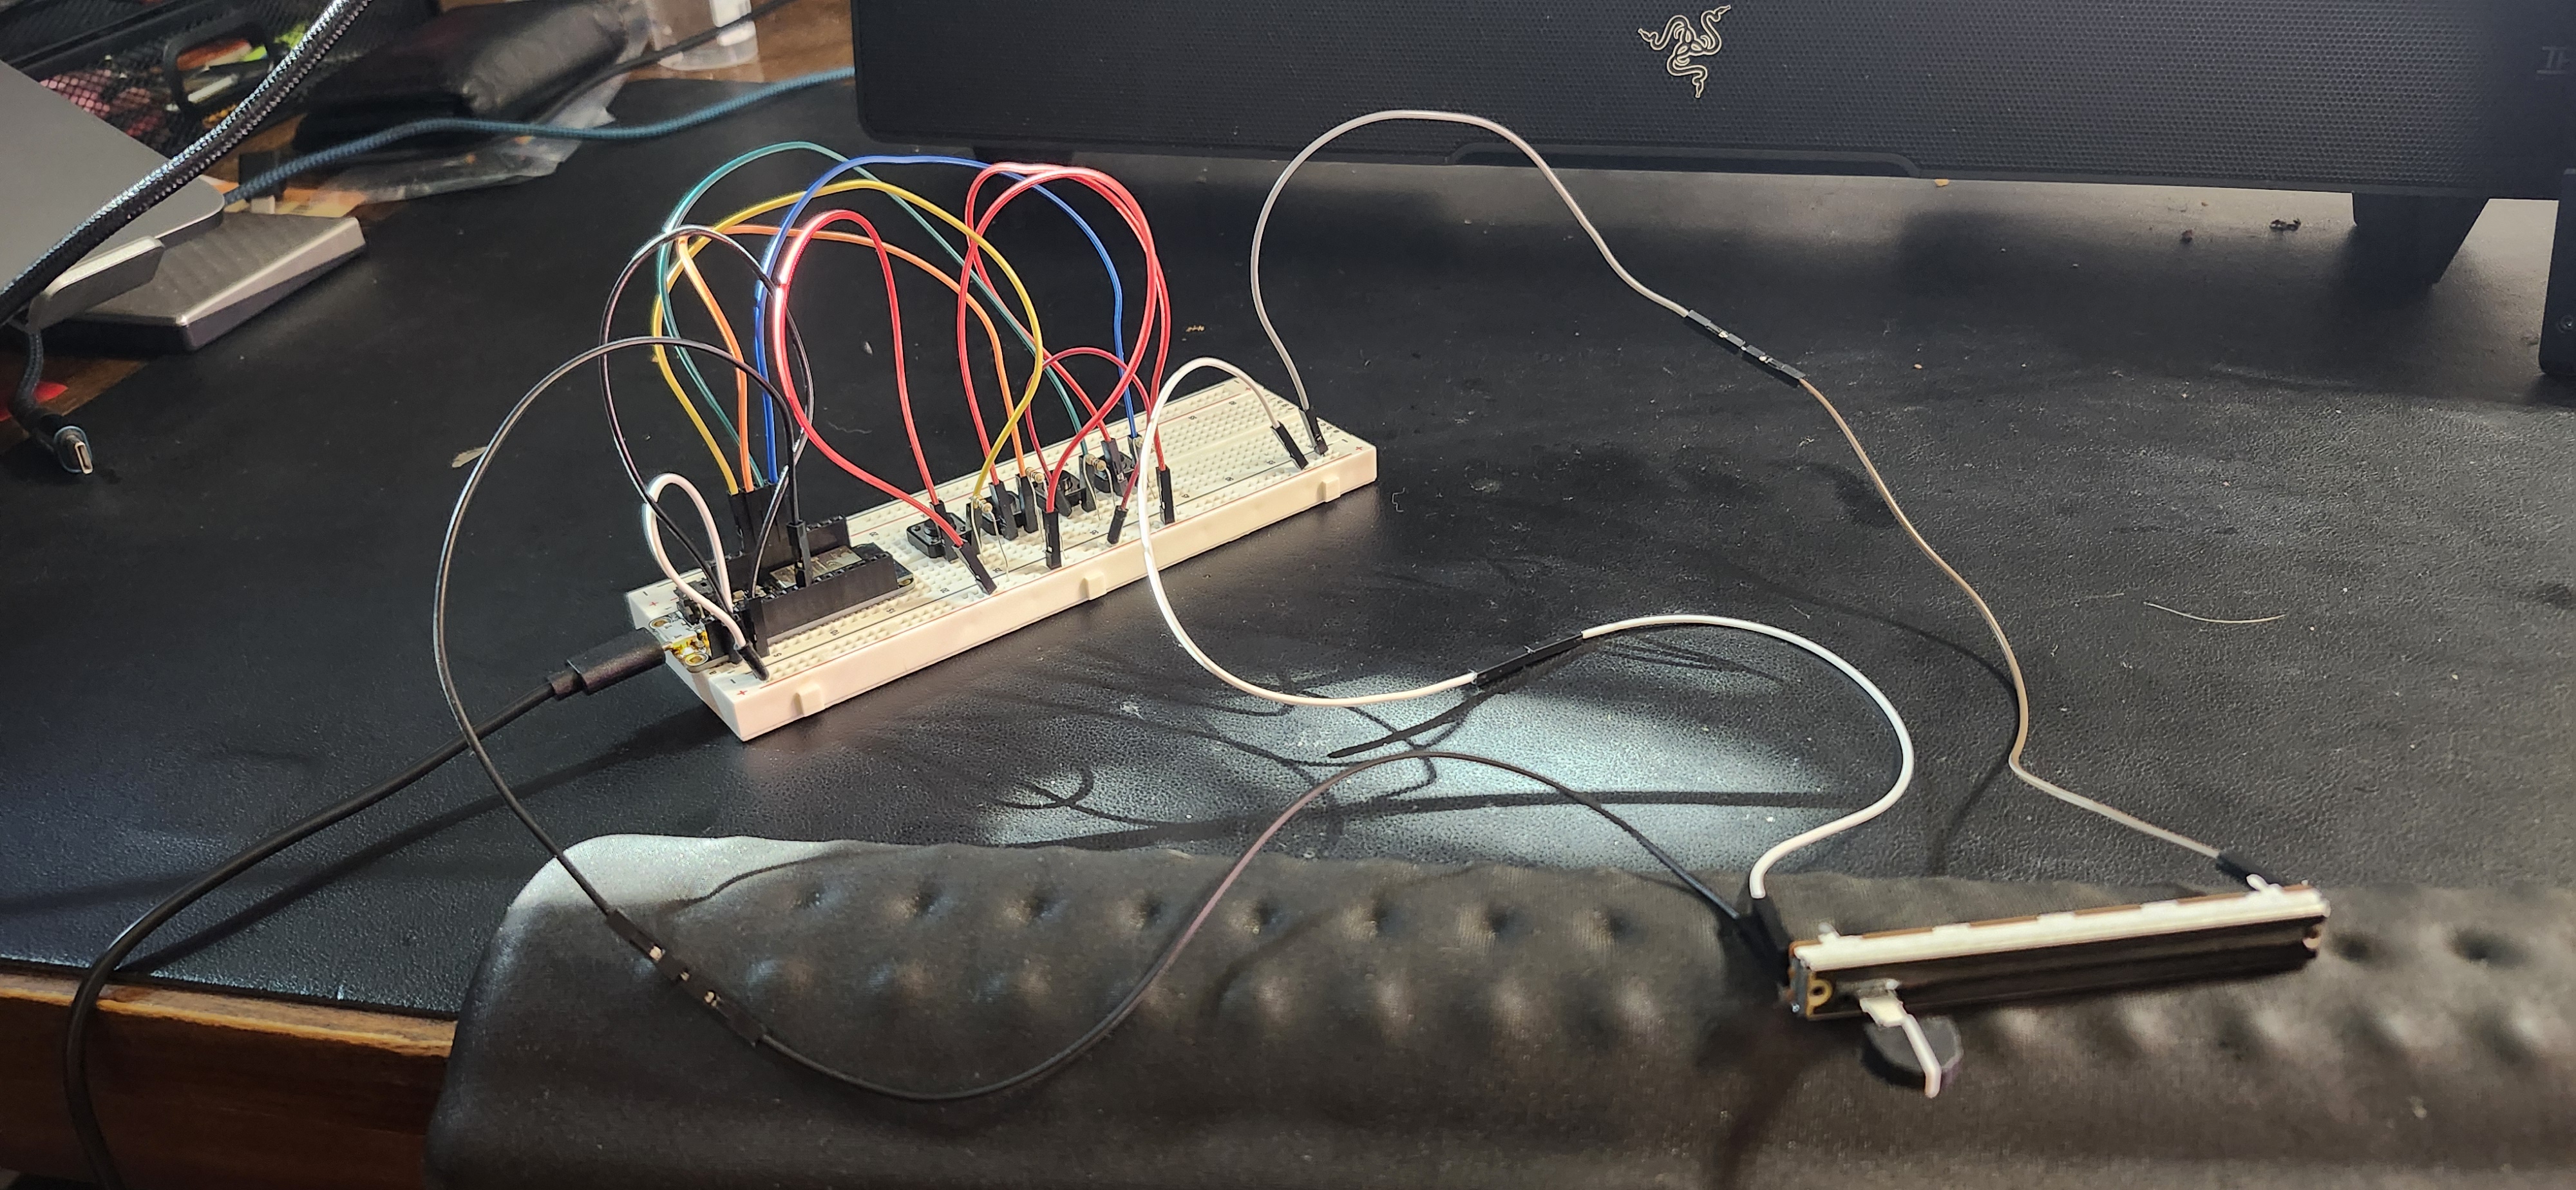
On the hardware side, the ESP32 reads four buttons and a B10K slide potentiometer. Each loop, it sends their values as a single line of comma-separated data over USB serial.
#define B1 13
#define B2 12
#define B3 27
#define B4 33
#define POT_PIN 32

void loop() {
  Serial.print(digitalRead(B1));
  Serial.print(',');
  Serial.print(digitalRead(B2));
  Serial.print(',');
  Serial.print(digitalRead(B3));
  Serial.print(',');
  Serial.print(digitalRead(B4));
  Serial.print(',');
  Serial.println(analogRead(POT_PIN));
}
In Processing, serial data is parsed and mapped to musical behavior. Each button triggers a drum sample, while the slider controls pitch by adjusting playback rate.
pitchRate = map(potRaw, 0, 4095, 0.5, 2.0);
pitchRate = constrain(pitchRate, 0.5, 2.0);

drums[i].rate(pitchRate);
drums[i].play();
An image of MF DOOM's iconic mask is divided into a grid of tiles. When a button is pressed, random hidden tiles are revealed, and newly revealed tiles briefly glow in response to the sound.
revealed[r][c] = true;On the hardware side, the ESP32 reads four buttons and a B10K slide potentiometer. Each loop, it sends their values as a single line of comma-separated data over USB serial.
#define B1 13
#define B2 12
#define B3 27
#define B4 33
#define POT_PIN 32

void loop() {
  Serial.print(digitalRead(B1));
  Serial.print(',');
  Serial.print(digitalRead(B2));
  Serial.print(',');
  Serial.print(digitalRead(B3));
  Serial.print(',');
  Serial.print(digitalRead(B4));
  Serial.print(',');
  Serial.println(analogRead(POT_PIN));
}
This project sits somewhere between an instrument, a game, and a piece of interactive visual art.
It asks a simple question:
What if making music wasn’t about building something new — but revealing something that already exists?
By tying sound, touch, and imagery together, the machine transforms rhythm into progress.
Sometimes, the beat isn’t the point. Sometimes, the beat is the key.
I built a simple balance board tracker using a Feather HUZZAH32, a vibration sensor, and a button. Hit the button to start a session, wobble away, and it logs how shaky or steady things are so I can look back over a week and spot patterns (and hopefully progress).
Dec 27, 2025
This project turns a balance board into a week-long “stability diary.” Using a vibration sensor and a single button, an ESP32 Feather HUZZAH32 measures how shaky (or smooth) my balance sessions are and uploads that data to Adafruit IO.
To visualize the week, I created a p5.js artwork called Kintsugi Balance Bowl: the “worst” wobble spikes become cracks in a ceramic bowl, and heal with signs of improvement.
I wanted something that felt like fitness feedback without being overly complicated. To kickstart the my return to getting back in shape, I wanted to look at how my sense of balance was developing. Using my trusty old Wii Balance Board, and a vibration sensor wired to that plus my Arduino, I was able to log my progress in a way that looked like a seismograph for my stance.
Inputs
Output
vibeAvg = average vibration intensity over the upload window (great for weekly graphing)
Instead of spamming raw sensor values, the sketch logs a summary every few seconds:
vibeAvg = the average “envelope” vibration value across the windowThat means you get clean data on Adafruit IO with a manageable upload rate.
Why this works:
Raw piezo readings are spiky and chaotic. By smoothing into a windowed “intensity,” my week-long graphs became readable and comparable.
config.hI learned about making this header file in class, and the important part is that it contains my Wi-Fi network + Adafruit IO credentials, which initializes io.
This is the full working version: one button action, one Adafruit feed, logs vibration intensity.
#include "config.h"

// HUZZAH32: A2 is GPIO34 (ADC1) -> safe with Wi-Fi
#define VIBE_PIN   A2
#define BUTTON_PIN 13   // button -> GND, using INPUT_PULLUP

AdafruitIO_Feed *myfeed = io.feed("balance_feed");

// Timing
const uint32_t SAMPLE_PERIOD_US = 2000; // 500 Hz sampling
const uint32_t UPLOAD_PERIOD_MS = 3000; // send every 3 seconds while logging

// Envelope / baseline
float baseline = 0;
const float BASELINE_ALPHA = 0.01f;

// Window stats (per upload window)
uint32_t winEnergy = 0;
uint32_t winSamples = 0;
uint16_t winPeak = 0;

// Button debounce
const uint32_t DEBOUNCE_MS = 30;
bool loggingOn = false;
bool lastBtnRead = HIGH;
bool btnStable = HIGH;
uint32_t lastDebounceMs = 0;

// Timers
uint32_t lastSampleUs = 0;
uint32_t lastUploadMs = 0;

void resetWindow() {
  winEnergy = 0;
  winSamples = 0;
  winPeak = 0;
}

void handleButtonToggle() {
  bool reading = digitalRead(BUTTON_PIN);

  if (reading != lastBtnRead) {
    lastDebounceMs = millis();
    lastBtnRead = reading;
  }

  if (millis() - lastDebounceMs > DEBOUNCE_MS) {
    if (reading != btnStable) {
      btnStable = reading;

      // Toggle only on press-down
      if (btnStable == LOW) {
        loggingOn = !loggingOn;

        if (loggingOn) {
          Serial.println("LOGGING START");
          resetWindow();
          lastUploadMs = millis();
        } else {
          Serial.println("LOGGING STOP");
          resetWindow();
        }
      }
    }
  }
}

void setup() {
  Serial.begin(115200);
  while (!Serial) delay(10);

  pinMode(BUTTON_PIN, INPUT_PULLUP);

  Serial.print("Connecting to Adafruit IO");
  io.connect();

  uint32_t t0 = millis();
  while (io.status() < AIO_CONNECTED) {
    io.run();
    Serial.print(".");
    delay(500);

    // Helpful status message if stuck connecting
    if (millis() - t0 > 6000) {
      Serial.println();
      Serial.print("AIO status: ");
      Serial.println(io.statusText());
      t0 = millis();
    }
  }

  Serial.println();
  Serial.println(io.statusText());

  // Seed baseline (quiet board at boot helps)
  baseline = analogRead(VIBE_PIN);

  lastSampleUs = micros();
  lastUploadMs = millis();

  Serial.println("Ready. Press button to start/stop logging.");
}

void loop() {
  io.run();
  handleButtonToggle();

  // Let Wi-Fi breathe
  delay(1);

  // Fixed-rate sampling
  uint32_t nowUs = micros();
  if (nowUs - lastSampleUs >= SAMPLE_PERIOD_US) {
    lastSampleUs += SAMPLE_PERIOD_US;

    int raw = analogRead(VIBE_PIN);

    // Slow baseline adaptation
    baseline = baseline * (1.0f - BASELINE_ALPHA) + raw * BASELINE_ALPHA;

    // Envelope value (vibration intensity)
    uint16_t env = (uint16_t)abs(raw - (int)baseline);

    if (loggingOn) {
      winEnergy += env;
      winSamples++;
      if (env > winPeak) winPeak = env;
    }
  }

  // Upload summary periodically while logging
  uint32_t nowMs = millis();
  if (loggingOn && (nowMs - lastUploadMs >= UPLOAD_PERIOD_MS)) {
    lastUploadMs += UPLOAD_PERIOD_MS;

    // Average envelope intensity
    uint16_t vibeAvg = (winSamples > 0) ? (uint16_t)(winEnergy / winSamples) : 0;

    Serial.print("Sending -> vibeAvg=");
    Serial.print(vibeAvg);
    Serial.print(" peak=");
    Serial.println(winPeak);

    // Upload ONE value to feed
    myfeed->save(vibeAvg);

    resetWindow();
  }
}
LOGGING START.vibeAvg rise and fall.
For the second half of this project, I used the idea of kintsugi—repairing broken pottery with gold—to represent how balance improves through repetition. Each day of practice becomes a “ring” on the bowl. The rings start near the outside and move inward over time, so the closer a ring is to the center, the more improvement it represents.
To make the difference between “damage” and “repair” easy to read, I use two different visual languages. Damage is drawn as jagged triangular chips that bite into the ring, like ceramic that’s been fractured. Repair is drawn as smooth gold arc stitches, sometimes with small beads, to simulate the gold filler used in kintsugi. As the days progress, the visualization intentionally shifts toward more gold: some of that comes from lower wobble (better stability), and some is a deliberate day-by-day increase so the week reads as a clear progression rather than a subtle statistical change.
Check out the full P5JS code HERE
function preload() {
  let url =
    "https://io.adafruit.com/api/v2/MarcusT_/feeds/balance-feed/data?limit=" +
    limit +
    "&include=value";
  data = loadJSON(url);
}
This project reminded me that a simple system can still feel meaningful if the idea is strong. I kept the hardware interaction super minimal (one button to start and stop logging) because I missed the day for sensor distribution and had to get creative with my limited option. The sensor ended up being a great “wobble detector”: it’s not pretending to measure perfect balance, but it captures the real moments. From tiny corrections, edge taps, and those sudden shakes when you lose stability and recover.
The biggest lesson for me was that the data pipeline is part of the design. Getting the ESP32 to behave while connected to Wi-Fi, deciding what to log (and how often), and keeping the feed clean enough to visualize made me think beyond just “does it work?” The Kintsugi bowl visualization brought everything together: vibration spikes become cracks, and the gold repair reframes those rough moments as progress instead of failure. Scrubbing through the timeline made the week feel like a story, which is exactly what I wanted... Data that’s not just numbers, but something I could actually reflect on.
At the heart of the system is a custom-built controller powered by an Arduino ESP32 Feather housed in a cardboard enclosure.
The interface includes:
This project sits somewhere between an instrument, a game, and a piece of interactive visual art.
It asks a simple question:
What if making music wasn’t about building something new — but revealing something that already exists?
By tying sound, touch, and imagery together, the machine transforms rhythm into progress.
Sometimes, the beat isn’t the point. Sometimes, the beat is the key.
I built a simple balance board tracker using a Feather HUZZAH32, a vibration sensor, and a button. Hit the button to start a session, wobble away, and it logs how shaky or steady things are so I can look back over a week and spot patterns (and hopefully progress).
Dec 27, 2025
This project turns a balance board into a week-long “stability diary.” Using a vibration sensor and a single button, an ESP32 Feather HUZZAH32 measures how shaky (or smooth) my balance sessions are and uploads that data to Adafruit IO.
To visualize the week, I created a p5.js artwork called Kintsugi Balance Bowl: the “worst” wobble spikes become cracks in a ceramic bowl, and heal with signs of improvement.
I wanted something that felt like fitness feedback without being overly complicated. To kickstart the my return to getting back in shape, I wanted to look at how my sense of balance was developing. Using my trusty old Wii Balance Board, and a vibration sensor wired to that plus my Arduino, I was able to log my progress in a way that looked like a seismograph for my stance.
Inputs
Output
vibeAvg = average vibration intensity over the upload window (great for weekly graphing)
Instead of spamming raw sensor values, the sketch logs a summary every few seconds:
vibeAvg = the average “envelope” vibration value across the windowThat means you get clean data on Adafruit IO with a manageable upload rate.
Why this works:
Raw piezo readings are spiky and chaotic. By smoothing into a windowed “intensity,” my week-long graphs became readable and comparable.
config.hI learned about making this header file in class, and the important part is that it contains my Wi-Fi network + Adafruit IO credentials, which initializes io.
This is the full working version: one button action, one Adafruit feed, logs vibration intensity.
#include "config.h"

// HUZZAH32: A2 is GPIO34 (ADC1) -> safe with Wi-Fi
#define VIBE_PIN   A2
#define BUTTON_PIN 13   // button -> GND, using INPUT_PULLUP

AdafruitIO_Feed *myfeed = io.feed("balance_feed");

// Timing
const uint32_t SAMPLE_PERIOD_US = 2000; // 500 Hz sampling
const uint32_t UPLOAD_PERIOD_MS = 3000; // send every 3 seconds while logging

// Envelope / baseline
float baseline = 0;
const float BASELINE_ALPHA = 0.01f;

// Window stats (per upload window)
uint32_t winEnergy = 0;
uint32_t winSamples = 0;
uint16_t winPeak = 0;

// Button debounce
const uint32_t DEBOUNCE_MS = 30;
bool loggingOn = false;
bool lastBtnRead = HIGH;
bool btnStable = HIGH;
uint32_t lastDebounceMs = 0;

// Timers
uint32_t lastSampleUs = 0;
uint32_t lastUploadMs = 0;

void resetWindow() {
  winEnergy = 0;
  winSamples = 0;
  winPeak = 0;
}

void handleButtonToggle() {
  bool reading = digitalRead(BUTTON_PIN);

  if (reading != lastBtnRead) {
    lastDebounceMs = millis();
    lastBtnRead = reading;
  }

  if (millis() - lastDebounceMs > DEBOUNCE_MS) {
    if (reading != btnStable) {
      btnStable = reading;

      // Toggle only on press-down
      if (btnStable == LOW) {
        loggingOn = !loggingOn;

        if (loggingOn) {
          Serial.println("LOGGING START");
          resetWindow();
          lastUploadMs = millis();
        } else {
          Serial.println("LOGGING STOP");
          resetWindow();
        }
      }
    }
  }
}

void setup() {
  Serial.begin(115200);
  while (!Serial) delay(10);

  pinMode(BUTTON_PIN, INPUT_PULLUP);

  Serial.print("Connecting to Adafruit IO");
  io.connect();

  uint32_t t0 = millis();
  while (io.status() < AIO_CONNECTED) {
    io.run();
    Serial.print(".");
    delay(500);

    // Helpful status message if stuck connecting
    if (millis() - t0 > 6000) {
      Serial.println();
      Serial.print("AIO status: ");
      Serial.println(io.statusText());
      t0 = millis();
    }
  }

  Serial.println();
  Serial.println(io.statusText());

  // Seed baseline (quiet board at boot helps)
  baseline = analogRead(VIBE_PIN);

  lastSampleUs = micros();
  lastUploadMs = millis();

  Serial.println("Ready. Press button to start/stop logging.");
}

void loop() {
  io.run();
  handleButtonToggle();

  // Let Wi-Fi breathe
  delay(1);

  // Fixed-rate sampling
  uint32_t nowUs = micros();
  if (nowUs - lastSampleUs >= SAMPLE_PERIOD_US) {
    lastSampleUs += SAMPLE_PERIOD_US;

    int raw = analogRead(VIBE_PIN);

    // Slow baseline adaptation
    baseline = baseline * (1.0f - BASELINE_ALPHA) + raw * BASELINE_ALPHA;

    // Envelope value (vibration intensity)
    uint16_t env = (uint16_t)abs(raw - (int)baseline);

    if (loggingOn) {
      winEnergy += env;
      winSamples++;
      if (env > winPeak) winPeak = env;
    }
  }

  // Upload summary periodically while logging
  uint32_t nowMs = millis();
  if (loggingOn && (nowMs - lastUploadMs >= UPLOAD_PERIOD_MS)) {
    lastUploadMs += UPLOAD_PERIOD_MS;

    // Average envelope intensity
    uint16_t vibeAvg = (winSamples > 0) ? (uint16_t)(winEnergy / winSamples) : 0;

    Serial.print("Sending -> vibeAvg=");
    Serial.print(vibeAvg);
    Serial.print(" peak=");
    Serial.println(winPeak);

    // Upload ONE value to feed
    myfeed->save(vibeAvg);

    resetWindow();
  }
}
LOGGING START.vibeAvg rise and fall.
For the second half of this project, I used the idea of kintsugi—repairing broken pottery with gold—to represent how balance improves through repetition. Each day of practice becomes a “ring” on the bowl. The rings start near the outside and move inward over time, so the closer a ring is to the center, the more improvement it represents.
To make the difference between “damage” and “repair” easy to read, I use two different visual languages. Damage is drawn as jagged triangular chips that bite into the ring, like ceramic that’s been fractured. Repair is drawn as smooth gold arc stitches, sometimes with small beads, to simulate the gold filler used in kintsugi. As the days progress, the visualization intentionally shifts toward more gold: some of that comes from lower wobble (better stability), and some is a deliberate day-by-day increase so the week reads as a clear progression rather than a subtle statistical change.
Check out the full P5JS code HERE
function preload() {
  let url =
    "https://io.adafruit.com/api/v2/MarcusT_/feeds/balance-feed/data?limit=" +
    limit +
    "&include=value";
  data = loadJSON(url);
}
This project reminded me that a simple system can still feel meaningful if the idea is strong. I kept the hardware interaction super minimal (one button to start and stop logging) because I missed the day for sensor distribution and had to get creative with my limited option. The sensor ended up being a great “wobble detector”: it’s not pretending to measure perfect balance, but it captures the real moments. From tiny corrections, edge taps, and those sudden shakes when you lose stability and recover.
The biggest lesson for me was that the data pipeline is part of the design. Getting the ESP32 to behave while connected to Wi-Fi, deciding what to log (and how often), and keeping the feed clean enough to visualize made me think beyond just “does it work?” The Kintsugi bowl visualization brought everything together: vibration spikes become cracks, and the gold repair reframes those rough moments as progress instead of failure. Scrubbing through the timeline made the week feel like a story, which is exactly what I wanted... Data that’s not just numbers, but something I could actually reflect on.
Hydro – tile grids for water, target, age, barren; column arrays for velCol, noiseColForest – 2D fields for willow and aspen (0–1). Growth moves toward a cap reduced by barren; blocked under lodges; harvest() does a ring search for richest patch.DamSpans – spans are {row, cL, cR, integrity} across a gap bounded by land. Integrity decays with time and high flow; collapsed spans are removed.Colony, Beaver – array of agents; mortality filter; metrics; per-beaver FSM with vector steering.Lodge – simple sprite; count tied to populationWhy this order: environment first, then resources, then structures that shape flow, then agents reacting to the current state.
Creates subsystems and enforces the following update order (water → resources → structures → agents).
class World {
  constructor(hud){
    this.hud=hud;
    this.hydro=new Hydro(hud);
    this.forest=new Forest(hud,this.hydro);
    this.dams=new DamSpans(hud,this.hydro);
    this.colony=new Colony(hud,this.hydro,this.dams,this.forest);
    this.lodges=[]; this.updateLodges(true);
  }
  update(){
    this.hydro.update();                     // rivers grow/branch/widen/dry
    this.forest.update(this.lodges,this.hydro); // growth capped by barren
    this.dams.update(this.hydro);            // span decay vs flow
    this.colony.update(this.dams,this.hydro);    // FSM + mortality
    if (this.colony.prunedThisTick){ this.updateLodges(); this.colony.prunedThisTick=false; }
    this.forest.blockUnderLodges(this.lodges,this.hydro);
  }
}The simulation starts with building a target river tree (trunk + noisy branches), reveals it over time (slider), then keep it alive with estuaries, widening, and right-side desiccation.
Beavers “feel” water via noiseCol[c] (stress driver).
regen(){
  this.water=grid(false); this.target=grid(false); this.barren=grid(0); this.growth=0;
  const trunk = walkBranch(2, rows*0.5, cols*0.85, 0, true); paintPath(trunk,5);
  for (let i=0;i<10;i++){ const pC=rand(6,cols*0.7), pR=clamp(noise(i*.3)*rows,2,rows-3);
    paintPath(walkBranch(pC,pR,rand(18,48), coin()?-1:+1,false),3);
  }
}
update(){
  // reveal target → water
  this.growth=min(1,(this.growth||0)+(0.002+hud.get("riverSpeed")*0.02));
  for (let c=0;c<floor(cols*this.growth);c++) for (let r=0;r<rows;r++) if (target[c][r]) water[c][r]=true;

  // desiccate far right → barren land
  for (let c=floor(cols*.75); c<cols; c++) if (random()<0.0008)
    for (let r=0;r<rows;r++) if (water[c][r]){ water[c][r]=target[c][r]=false; barren[c][r]=min(1,barren[c][r]+.4); }

  // estuaries & widening (if undammed & old)
  if (++branchTimer>240){ branchTimer=0; /* spawn small branch from wet pivot; paintPath(...,2) */ }
  // …age water; leak to neighbors when age>180 && !damSpans.hasDamNear(c,r,4)

  recalcColumns(); // sets velCol[], noiseCol[] from wet fraction per column
}
Willows (for building dams) and Aspen (food for the beavers) grow on land toward a cap that shrinks with barren; growth is blocked under lodges and zeroed on water.The simulation starts with building a target river tree (trunk + noisy branches), reveals it over time (slider), then keep it alive with estuaries, widening, and right-side desiccation.
Resulting effects: near water → fertile patches; dry right side → patchy, low-cap growth.
regen(){
  this.water=grid(false); this.target=grid(false); this.barren=grid(0); this.growth=0;
  const trunk = walkBranch(2, rows*0.5, cols*0.85, 0, true); paintPath(trunk,5);
  for (let i=0;i<10;i++){ const pC=rand(6,cols*0.7), pR=clamp(noise(i*.3)*rows,2,rows-3);
    paintPath(walkBranch(pC,pR,rand(18,48), coin()?-1:+1,false),3);
  }
}
update(){
  // reveal target → water
  this.growth=min(1,(this.growth||0)+(0.002+hud.get("riverSpeed")*0.02));
  for (let c=0;c<floor(cols*this.growth);c++) for (let r=0;r<rows;r++) if (target[c][r]) water[c][r]=true;

  // desiccate far right → barren land
  for (let c=floor(cols*.75); c<cols; c++) if (random()<0.0008)
    for (let r=0;r<rows;r++) if (water[c][r]){ water[c][r]=target[c][r]=false; barren[c][r]=min(1,barren[c][r]+.4); }

  // estuaries & widening (if undammed & old)
  if (++branchTimer>240){ branchTimer=0; /* spawn small branch from wet pivot; paintPath(...,2) */ }
  // …age water; leak to neighbors when age>180 && !damSpans.hasDamNear(c,r,4)

  recalcColumns(); // sets velCol[], noiseCol[] from wet fraction per column
}
Dam Spans exist only across contiguous water segments bounded by land; integrity increases with work and decays with flow.
This prevents the beavers from spam building, and makes dams visually & mechanically legible.
regen(){
  this.water=grid(false); this.target=grid(false); this.barren=grid(0); this.growth=0;
  const trunk = walkBranch(2, rows*0.5, cols*0.85, 0, true); paintPath(trunk,5);
  for (let i=0;i<10;i++){ const pC=rand(6,cols*0.7), pR=clamp(noise(i*.3)*rows,2,rows-3);
    paintPath(walkBranch(pC,pR,rand(18,48), coin()?-1:+1,false),3);
  }
}
update(){
  // reveal target → water
  this.growth=min(1,(this.growth||0)+(0.002+hud.get("riverSpeed")*0.02));
  for (let c=0;c<floor(cols*this.growth);c++) for (let r=0;r<rows;r++) if (target[c][r]) water[c][r]=true;

  // desiccate far right → barren land
  for (let c=floor(cols*.75); c<cols; c++) if (random()<0.0008)
    for (let r=0;r<rows;r++) if (water[c][r]){ water[c][r]=target[c][r]=false; barren[c][r]=min(1,barren[c][r]+.4); }

  // estuaries & widening (if undammed & old)
  if (++branchTimer>240){ branchTimer=0; /* spawn small branch from wet pivot; paintPath(...,2) */ }
  // …age water; leak to neighbors when age>180 && !damSpans.hasDamNear(c,r,4)

  recalcColumns(); // sets velCol[], noiseCol[] from wet fraction per column
}
Beavers are need-driven agents with vector steering.
Input from the right-side menu allows the user to shape conditions.
regen(){
  this.water=grid(false); this.target=grid(false); this.barren=grid(0); this.growth=0;
  const trunk = walkBranch(2, rows*0.5, cols*0.85, 0, true); paintPath(trunk,5);
  for (let i=0;i<10;i++){ const pC=rand(6,cols*0.7), pR=clamp(noise(i*.3)*rows,2,rows-3);
    paintPath(walkBranch(pC,pR,rand(18,48), coin()?-1:+1,false),3);
  }
}
update(){
  // reveal target → water
  this.growth=min(1,(this.growth||0)+(0.002+hud.get("riverSpeed")*0.02));
  for (let c=0;c<floor(cols*this.growth);c++) for (let r=0;r<rows;r++) if (target[c][r]) water[c][r]=true;

  // desiccate far right → barren land
  for (let c=floor(cols*.75); c<cols; c++) if (random()<0.0008)
    for (let r=0;r<rows;r++) if (water[c][r]){ water[c][r]=target[c][r]=false; barren[c][r]=min(1,barren[c][r]+.4); }

  // estuaries & widening (if undammed & old)
  if (++branchTimer>240){ branchTimer=0; /* spawn small branch from wet pivot; paintPath(...,2) */ }
  // …age water; leak to neighbors when age>180 && !damSpans.hasDamNear(c,r,4)

  recalcColumns(); // sets velCol[], noiseCol[] from wet fraction per column
}
G generate new river; SPACE pause.Hydro.target
This closes the system loop: environment drives needs; agents act; structures reshape the environment; HUD lets you adjust parameters and watch new equilibria emerge.


Designing experiences that
touch, move, and inspire